Logs Drilldown JSON viewer
You can easily view and interact with your JSON formatted logs using the Logs Drilldown JSON viewer. This view will help you read your JSON style logs, and filter through them to make your related visualizations more relevant and focused.
Note
Logs Drilldown JSON Viewer is an experimental feature. Engineering and on-call support is not available. Documentation is either limited or not provided outside of code comments. No SLA is provided. To use this feature, you must be running Loki 3.5.0 or later.
Viewing JSON logs
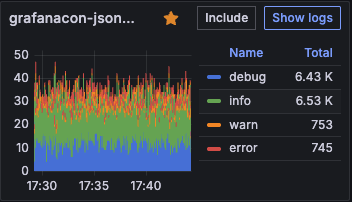
To interact with the JSON view, select the Show Logs button for your service in Logs Drilldown.

From there, select JSON in the Logs format menu. This will show your logs in a structured, collapsible way, enabling you to sort, filter, and otherwise adjust your log data in the visualizations for your logs.

Filtering log lines with the JSON view
You can include and exclude specific log data from your visualizations by selecting the Include/Exclude icons next to a given label.
For example: Given a set of logs from am API request service, you can select the Exclude button next the method field with status “GET”. This will result in the Log Volume dashboard showing only requests of other method types (DELETE/PATCH/POST/PUT).
To include filtered log data again, remove the excluded data from the Fields filter above the Logs Volume visualization.
Supported JSON log types
Log lines entirely formatted as JSON are supported.
Log lines with only certain fields or metadata structured as JSON are not currently supported.
Note
We are keen to improve this feature, so please contact us if there is something that would help you find the signal in the noise.


